Pages

Monday, April 18, 2011

Facebook New-Generation Data Center

Facebook has built a new Data Center raising the bar in terms of energy efficiency and operating costs.

Facebook claims this data center is using some of the state-of-the art technologies and designs to reduce energy consumption, be more energy-efficient and so more greeny. Let's take a quick tour of the key characteristics :
  1. Server design
    • 2 types of custom motherboards (AMD & Intel) designed to eliminate every bit of waste (plastic, useless chips) and optimize them for facebook workloads (lot of RAM).
    • Chassis is also custom, screw-less and designed to be easy to insert/change elements in it.
    • The 450W power supply converts to 12.5VDC and is self-cooled.
  2. Cooling Design[2]
  3. Backup Battery:
    • a rack of battery are placed in between 2 triplet racks. These batteries will furnish sufficient energy for both of those triplet racks in case of energy failure.
Facebook claims a PUE of 1.07 (~93% of total energy is used for IT equipment) which seems to be the best in class right now. For a point of comparison, industry average is 1.5 (~66%). And 2 years ago, Google's best data center was operating at 1.12 (~89%) with an average of 1.19 (~84%)[6]. Additionally, Facebook also claims that this design consumes 38% less energy and is 24% less costy than their own current datacenter. Quite impressive!

Altough this new design is good news. There is a better news! Indeed, the actual good news is that Facebook has changed the usual behavior of data centers designers. Currently, there is few data about data centers designs and it is hard to gather data like actual efficiency, failure rates, etc... Facebook made a first (big) step by releasing their design as "open source". So now, people around the world can use those designs, improve upon them and hopefully share these. No IP to worry about! That's a tremendous news! So don't be shy, go read details of the design at Open Compute website!

I can't end this post without a list of questions about the design :
  1. operating temperature:  Some of the state-of-the art data center design are operating around 35°C (95°F). I've heard they're running at 22°C (72°F)[3]
  2. very low consumption server: although Facebook is talking with ARM.
  3. Why not using containers i.s.o triple rack? Because Google is the "inventor" of this technique?!? I would not believe it.
  4. network design?
  5. Why the hell are they using coal energy as power source? [4]
P.S. : I'm curious to know whether someone already wondered about sound conversion to some other useful energy?!? Indeed, data centers are not sound-free. :)

Thursday, April 7, 2011

Cloud Economics

This was a "quick" answer to another post in my company blog (no, no public access).

My point of view is simple : When considering cloud as a new paradigm, elasticity is a KEY component. Without elasticity, you're just a cloud wannabe.

So speaking strictly of costs, I agree with the affirmation that "Cloud is going from CapEx to OpEx". Though, I would also like to stress the following:
Cloud should allow to decrease the overall of CapEx and OpEx together.
  • Decreasing CapEx because of dynamism
    You're optimizing your infrastructure resources and so buying less infra (or you're simply leasing it)
  • Decreasing OpEx because of dynamism & automation
    • Costs to add/remove instances, services, etc… are near 0
    • Or taking Hamilton's estimates[1], in a very large data center, 1 admin should be able to run >1000 servers alone i.s.o of ~140 in a medium data center.
    • It seems that for Google it is around 1 admin per 10.000 servers and they have a goal of 1 admin per 100.000 servers ! [2]
  • Decreasing OpEx because of an external service:
    Indeed, for customers using a public cloud you get rid of storage mgt, system upgrades, ...
There are mainly two factors to reduce cloud users costs:[3 (slides 7-10)]
  • Elasticity:
    • Here is a common strategy to buy hardware in a typical Static Data Center
      1. evaluate what will be the demand peak
      2. Buy HW supporting twice this demand
      3. End with a underutilized infrastructure (typically 10-20% resources usage on average)
    • Elasticity enables customers to pay only for what you are really consuming!
      • The "pay as you go" business model … because you don't have to overprovision your infrastructure.
      • The "pay as you grow" model, for the services growing suddenly, you're able to service the demand as it's growing. While if you had to acquire/install infrastructure, you should have a good capacity planning and having good estimates which is not an obvious task.
    • Good to note that Private Cloud Leaders like Google, Amazon & al started to sell their cloud because it enables to amortize their own cloud infrastructure by monetizing their idle time.
  • Economies of Scale
      Here are costs presented by Hamilton for current typical data centers Resources
                    • Cost in medium DC
                      Cost in Very Large DC
                      Ratio
                      Network
                      $95 / Mbps / month
                      $13 / Mbps / month
                      7.1x
                      Storage
                      $2.20 / GB / month
                      $0.40 / GB / month
                      5.7x
                      Admin
                      ~140 servers / admin
                      >1000 servers / admin
                      7.1x
                        • It means that costs difference between medium and large data centers are between 5-7x ! Huge difference. In the case of Google, some speaks of 100x ! [1, 2]
                        • Also, I would like to remember is that it is not a projection. And as engineers, we should also think in terms of what we'll get tomorrow . IOW, the economies of scale will be yet an order of magnitude higher for exascale data centers.


                      By considering only these 2 points, it is easy to understand why there is a high probability customers would like to use the cloud to admin their services, even steady one. To name them, because of capacity planning and economies of scale.

                      Of course, when you want to adopt cloud you have to consider some others characteristics like network bandwidth & storage bottlenecks or some business ones like data confidentiality & auditability, security & vendor lock in.

                      So when thinking cloud solutions we should always think to the following
                      • Optimization, Automation, Dynamicity, Resources Synergy, Transparency.


                      "Pay as You Go" model is something which imposes that you'll bill your customers only what he is actually using. IOW, in the theory, if the CPU of one server is idle, he is not using this server and should not be billed.
                      "Pay as you Grow" model trends is to have instantaneous elasticity. If the one service grows quickly, the infrastructure grows to attend the peak. If one service demand shrinks, infrastructure adapts itself and shrinks too. Of course, customers costs will vary too growing and shrinking but the idea is to get the infrastructure following the demand.

                      Lowering Costs:
                      • Any solution to reduce power/cooling costs is welcome.
                      • Strong emphasis to automate Administration in order to shift people cost from top costs to nearly irrelevant. Remember: 1admin per 100.000 servers!
                        No good network automation to date : OpenFlow is one option!
                      Last but not least, we should see the "data center as a computer". This simple sentence has deep implications.
                      Customer should not even know there are several racks, several CPUs, several layers of caches, etc…
                      In an ideal world, a customer should be able to buy some resources from a Cloud Provider, install its application/service and running it without thinking to provisioning and capacity planning. That's the first step of Cloud Computing.

                      I would like to see more! Indeed, a customer should not worry about what is the cloud platform (vendor lock-in) he's running on. Standards APIs (similar to POSIX) should exist in order to have guaranteed interoperability between cloud such that if you want to migrate from one cloud to another, it's just a matter of moving your data. Only by then, we'll get to the Cloud OS.


                      References:
                      [1] "Cloud Computing Economies of Scale", James Hamilton
                      [2] "Cloud Computing: Understanding Economies of Scale, Cloudscaling Blog
                      [3] "Above the Cloud, Dave Patterson

                      Internet Maps

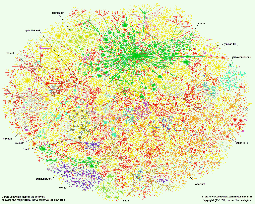
                      Yesterday I saw a new incredible Internet Map (or better infographic) made by Teleography
                      After having seen that last map, I thought it might be fun to have a post showing various kind of attempts to creat Internet Map since its start.
                      My first contacts with Internet Map is quite old since it started in 1999. This map has been made by Cheswick from Bell Labs and he created the Internet Mapping Project (gallery).

                      Roughly, it shows connectivity between ISPs in the world.

                      But since then, some other efforts to map the Internet have been made like by Opte

                      CAIDA is probably the best in its class with great topology representations (Main gallery, Walrus gallery)

                      One question people might ask themselves is why would we bother about visually representing the internet? Well, there are a lot of bits to that answer. In 2 words, there is no best way to try to understand than by visually stating a problem. It means that we understand better the Internet once it has been graphically represented. Of course, every different representation brings its own bits of interpretation and enables deeper and further understanding.
                      But also, a graph is nothing more than a mathematical representation and as such CAIDA has been a source of information for researchers worldwide by providing data sets of these representations which helped to think on the Internet represented as a graph (or better as a variety of graphes).
                      And finally, better understanding or better characterizing Internet structures/behaviors has been the basis for improvements of it.
                      Note to mention that there are multiple ways to represent the Internet facets.

                      A first interesting view has been created by World Web Maps. They put web sites on top of the World Map correlating web sites popularity with country sizes.

                      Facebook made another interesting map. They create a friendship world map showing geographical connection between people.


                      There had been an effort to create an Atlas of Cyberspaces. This project gathered a lot of maps of all sorts though it seems dead now.

                      So, to end this post, I guess we should thank people having spent their time to graphically represent the Internet in all of its forms. They all helped getting a better one for today. And in case, you're aware of some other forms of Internet representations I've not mentioned in this post, please share them!